


If you wear a Dexcom Stelo, G7, or ONE+ and you have ever pulled up your glucose trend in a third-party app only to notice the timestamp is hours behind the clock on the wall, you are not imagining it, and you are not doing anything wrong. The sensor is fine. The handoff between apps is the slow part.
The gap is in the handoff
Dexcom’s sensor samples interstitial glucose about every five minutes and sends each value to the Dexcom app over Bluetooth. That part works exactly as advertised. The delay shows up one layer downstream, when the Dexcom app exports those values to Apple Health on iPhone or Health Connect on Android.
That export is held back on purpose. Dexcom’s own support pages say so, in one sentence each: for the G7, “Apple Health receives your Dexcom G7 information after a three-hour delay, not in real time”; for Stelo, “Stelo sends your glucose data to health apps with a 3-hour delay”; for Health Connect on Android, “Data is shared with a 3-hour delay, not in real time.” None of the three pages says why. My reading is that it is a regulatory line, not a technical one. The Dexcom app is the cleared medical display, and its alerts are the ones people act on. Apple Health and Health Connect are general stores that any app can read, and a three-hour hold makes sure no app downstream of them can be mistaken for a real-time glucose monitor. That is a defensible choice for Dexcom. It is also why every app that reads from Apple Health or Health Connect shows you a number that is three hours old.
For a once-a-day glance at the trend, that lag barely registers. For anyone trying to connect a meal to the glucose response it caused, three hours is the difference between a chart that teaches you something and a chart that is noise. You eat lunch at noon. The rise lands in Apple Health as having happened sometime between noon and three, smeared across a window wide enough to blame the wrong meal entirely.
I have spent 35-plus years building software at the intersection of biology and computation, and this is a timestamp problem, which makes it a solvable one.
How the direct read works, and whose shoulders it stands on
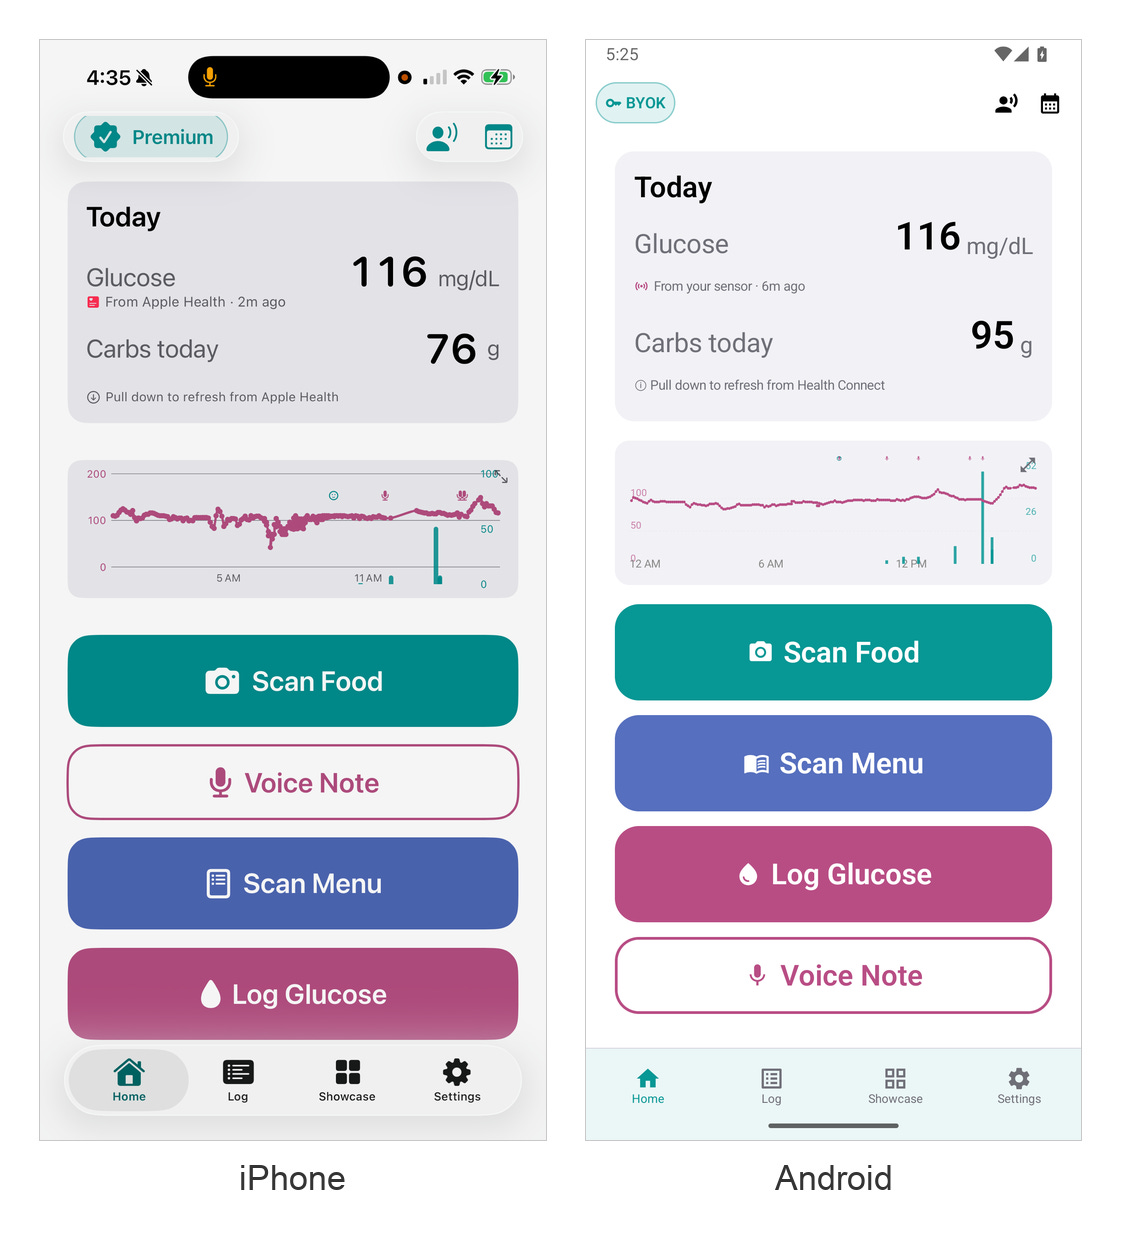
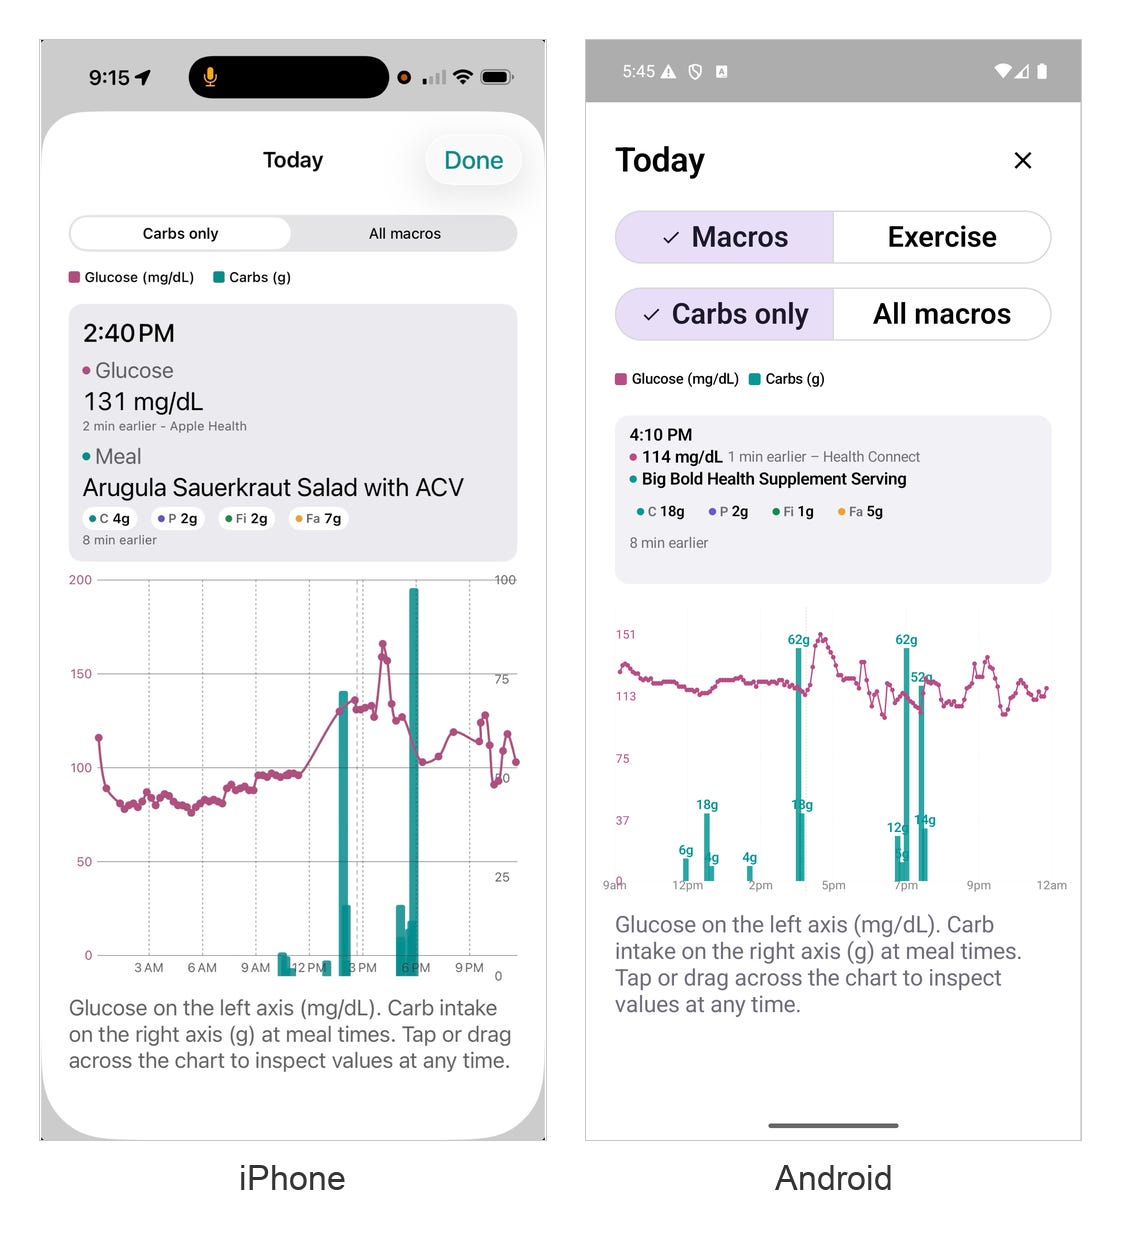
Food Health TxD is the diabetes companion to Food Health AI: Scan & Score, built by Eidogen-Sertanty for people managing Type 1, Type 2, or prediabetes. It scans a meal photo for carbs and macros and lines the meal up against your glucose on one chart. The feature relevant here is a beta called Direct Sensor Reading, and I want to be specific about where it comes from, because it is built on two open-source projects the diabetes community has maintained for years.
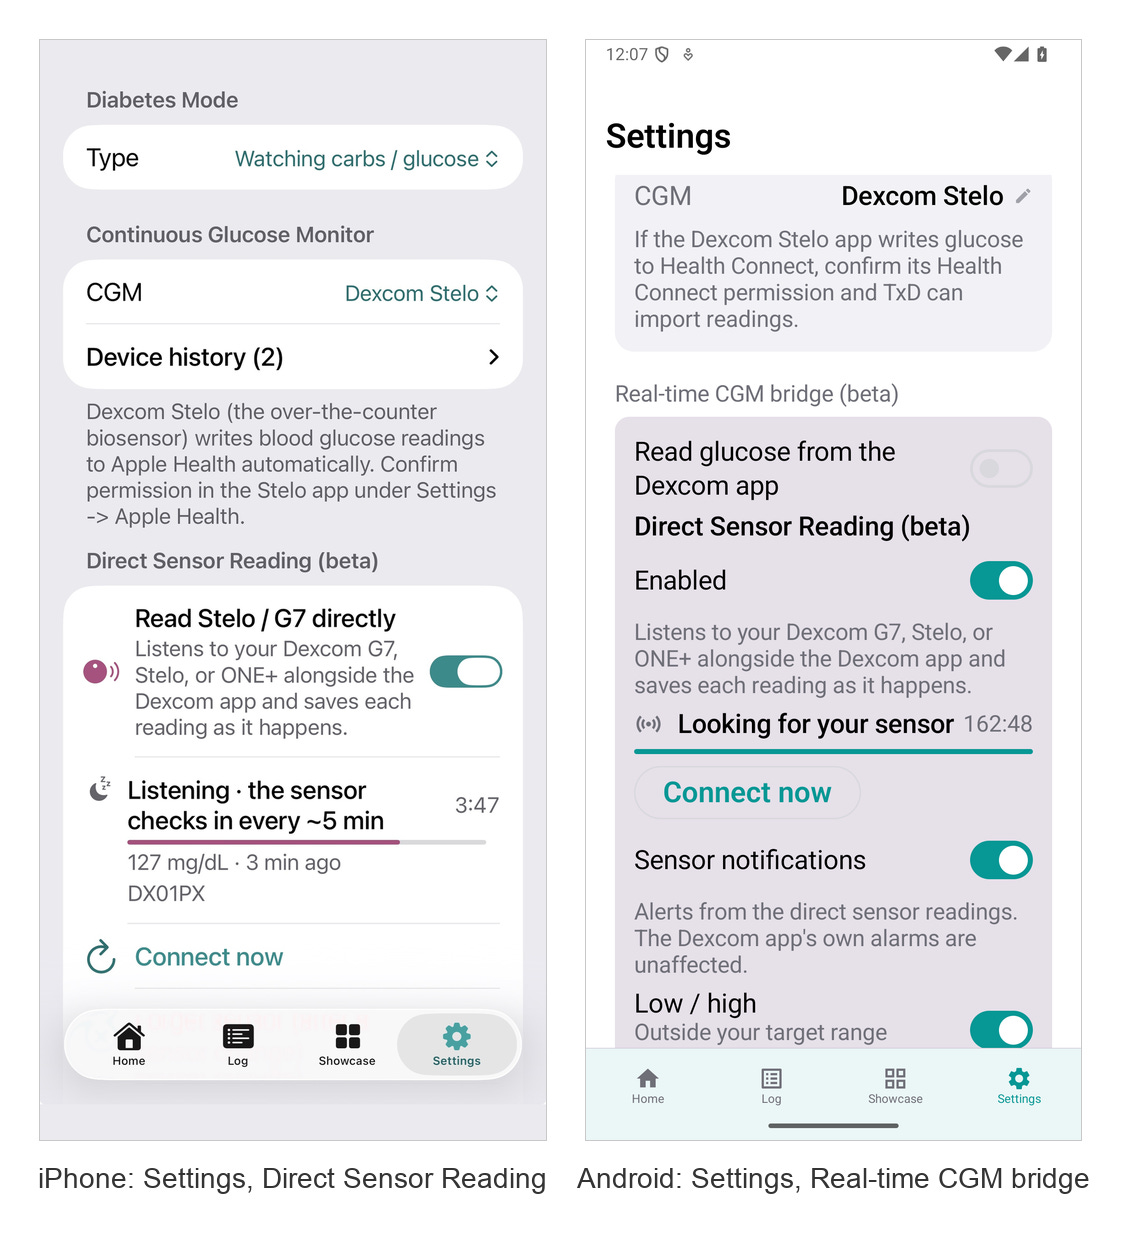
On iPhone, the direct read is built on the engine of xDrip4iOS (https://github.com/JohanDegraeve/xdripswift), the community CGM app. xDrip4iOS can connect to a Dexcom G7, ONE+, or Stelo over native Bluetooth in what it calls Coexistence mode: the Dexcom app keeps owning the sensor, and the listener joins the same Bluetooth session. No pairing code, nothing changes in the Dexcom app. When you turn on Direct Sensor Reading in Settings, TxD does one job with that engine: it listens for each reading and writes it to Apple Health the moment it arrives, with backfill. The Bluetooth transmitter code is the community’s work, and the license is GPL-3.0, same as upstream.
On Android, the direct read is built on xDrip+ (https://github.com/NightscoutFoundation/xDrip), the Nightscout Foundation’s CGM engine. Android only lets one app hold a sensor’s Bluetooth connection, so the recommended path uses xDrip+’s notification-based collector: the Dexcom app keeps the sensor, and TxD reads each reading off the Dexcom app’s notification and writes it to Health Connect. For people who want the listener to own the sensor outright, the direct Bluetooth path is there too, through the optional real-time bridge in Settings.
Either way, sensor data you have already paid for and are already wearing reaches your chart in minutes instead of hours. A meal and the rise it caused end up on the same timeline.
Things to be direct about, because this is a health app and the caveats matter as much as the feature:
Direct reading is a beta and it is off by default. You turn it on deliberately in Settings.
TxD never pairs with, writes to, or takes over your sensor. The Dexcom app stays in charge of your sensor and your alerts. Keep those alerts on.
TxD’s own notices (readings stopped or resumed, sensor status, lows, highs, fast rises or drops against your own target range) are convenience notices and do not replace medical alarms.
Nothing in TxD is a glucose estimate or a prediction. Values come from your sensor, from Apple Health or Health Connect, or from your own manual entry. The app is for education and tracking, and none of it replaces your healthcare provider.
Every other CGM that writes to Apple Health or Health Connect keeps working in TxD as before. Abbott Lingo and Libre 3 use encrypted Bluetooth and stay on the delayed Health path.
Dexcom, Stelo, G7 and ONE+ are trademarks of Dexcom, Inc. Food Health TxD is not affiliated with or endorsed by Dexcom, and it is not a medical device.
Why minutes matter: the voice and face check-ins
Once readings arrive in near real time, a second thing becomes possible, and it is the reason the Voice Note button sits on the TxD home screen. I wrote about the case for talking to a computer instead of typing at it in a separate piece (Why I Started Talking to My Computer Instead of Typing at It, linked below). The short version: the human voice carries information about the body that a keyboard never captured, and the research on voice and glucose is real, recent, and unfinished.
What the literature says, in brief:
Kaufman and colleagues at Klick Labs (Mayo Clinic Proceedings: Digital Health, 2023) recorded 267 people saying a fixed six-second phrase up to six times a day, 18,465 recordings in all, and classified Type 2 diabetes from 14 acoustic features at 0.89 accuracy in women and 0.86 in men, with age and BMI in the model.
The same group (Scientific Reports, 2024) put 505 people on a CGM for two weeks with the same fixed phrase, and found that within a person, fundamental frequency rises about 0.02 Hz per mg/dL of glucose. Small, real, and the authors concluded any predictive model would have to be personalized.
Lehmann and colleagues (Diabetes Care, 2026) collected 540 smartphone recordings from 22 adults with Type 1 diabetes under clamped normal and low glucose and detected hypoglycemia from sustained vowels with machine learning.
Hepkarsi and colleagues (Journal of Voice, 2026) measured vocal shimmer in 101 pregnant women and found it elevated in gestational diabetes.
Hamdan and colleagues’ 2024 systematic review and meta-analysis found no significant group difference in the classic single measures (jitter, shimmer, harmonics-to-noise ratio, F0) between Type 2 diabetes and controls. The machine-learning papers find signal where single-feature group comparisons do not, which says the signal is distributed and small.
Shukla and colleagues (Journal of Medical Internet Research, 2026) audited the Bridge2AI voice dataset and showed that age imbalance alone can produce the high accuracies reported for voice screening. Demographic confounding is a live risk in this field.
Two things stand out from that list. First, the within-person, longitudinal question (does my voice track my glucose over time) is the one that matters for a person wearing a CGM, and it is the one with the thinnest evidence. Second, we checked every public repository we could find (Zenodo, PhysioNet, Synapse, figshare, Kaggle, Hugging Face and the rest) and there is still no public dataset that pairs raw voice or face captures with glucose values. The only labeled voice-plus-CGM data anyone will have is first-party data, collected by the person whose glucose it is.
We ran two of our own experiments before building anything into the app. On the public VOCADIAB voice-embedding set (607 adults, Type 2 yes/no), a random forest on voice alone reached an AUC of 0.64 to 0.71 depending on sex, and age plus BMI alone did as well or better. The published cross-sectional accuracies are demographics plus voice. Then, with no audio at all, we lined up 1,359 of my own dictation transcripts against Stelo readings within 15 minutes: speaking rate correlated with glucose, most of it was time of day, and a small residual survived after removing day and hour. Real, tiny, per-person. Exactly the shape of the Klick F0 result, and enough to justify collecting audio.
What the app does with a check-in
So TxD collects the data the field is missing, on the phone, and it does the first modeling there too.
A face check-in is a front-camera photo, once a day or when you choose. A voice check-in is a clip of up to 30 seconds, either a free note about a meal or your day, or a fixed read-aloud passage so clips are comparable from one day to the next. After a face capture the app offers that passage, so voice and face are captured at the same moment. When a direct reader is active and your glucose is rising or falling fast, the app can also ask for a photo or a note right then, so the outer bands of your range get sampled too. All of this is off by default and lives under Settings, Voice & Face.
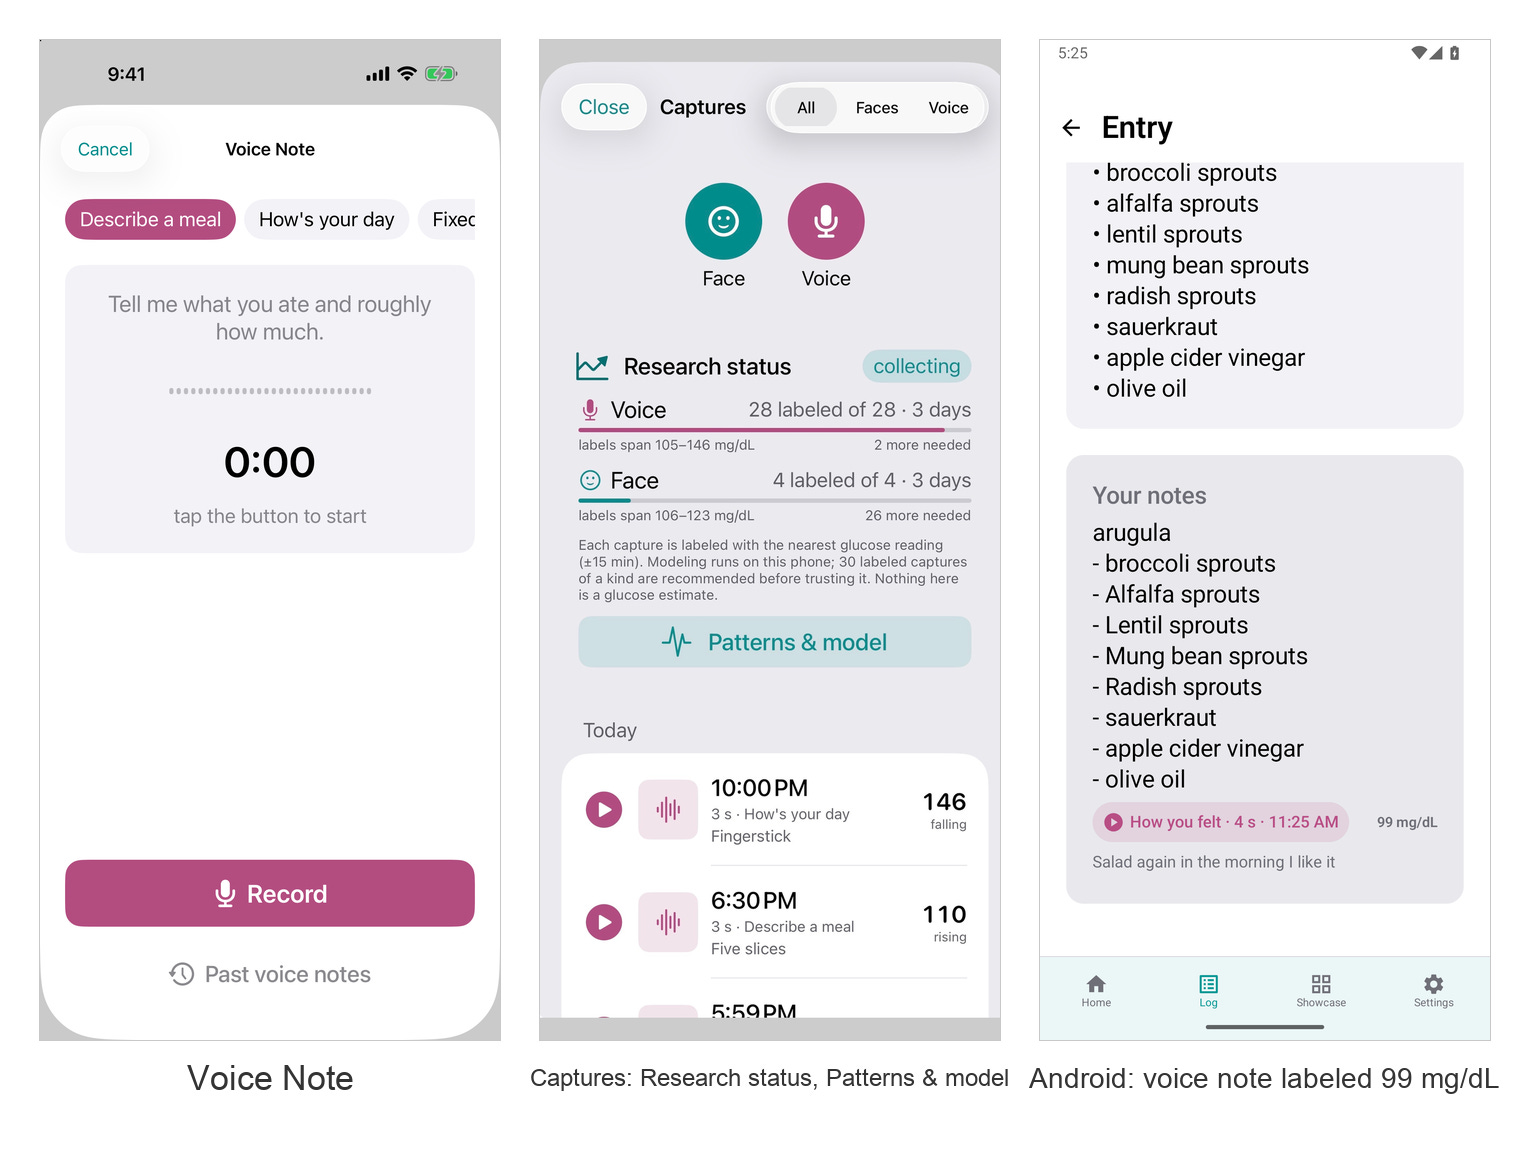
Each capture is labeled with the nearest glucose reading within 15 minutes, with the slope and the number of readings, and the label stays provisional until 17 minutes after the capture so the readings after it count as well. That labeling is the part the three-hour delay would have broken. With the direct read, a label is available within minutes of the capture.
On the phone, every voice clip is reduced to nine acoustic features: F0 mean and spread, jitter, shimmer, intensity, voiced and pause fractions, spectral centroid, and words per second from the transcript. The pitch tracker is autocorrelation on 25 ms windows and was checked against Praat on real clips. Every face photo is reduced to ten features from Apple’s Vision landmarks and CIELAB color patches: eye openness, brow-to-eye gap, mouth aspect, head roll, under-eye and cheek and forehead lightness, periorbital darkness, and cheek redness and yellowness. No geometric warping of the face, and the photo itself goes nowhere.
Once a person has 10 labeled captures over 3 days (30 recommended), the Patterns page runs three analyses on the device:
A Spearman correlation of every feature against mg/dL, with a day-block permutation test, so many clips on one day cannot masquerade as many independent days.
A leave-one-day-out ridge regression on standardized features, compared against predicting the training days’ mean. If ridge does not beat that, the verdict says so.
A three-band random forest (low, baseline, high), with the bands cut at the sensor’s own 15th and 85th percentiles for that person, evaluated leave-one-day-out with accuracy, Matthews correlation, per-band precision and recall, and a permutation p. The forest is 300 trees, ported from the reference Python script so the phone and the desktop produce the same answer.
Transcription uses Apple’s on-device recognizer with on-device recognition required, so audio never leaves the phone. Voice and face captures, their features, their labels, and the model run all stay on the device, and a TxD export carries them if you want to analyze them yourself. Nothing on the Patterns page is a glucose estimate. It is a per-person research readout, and it says in plain words when there is no signal yet.
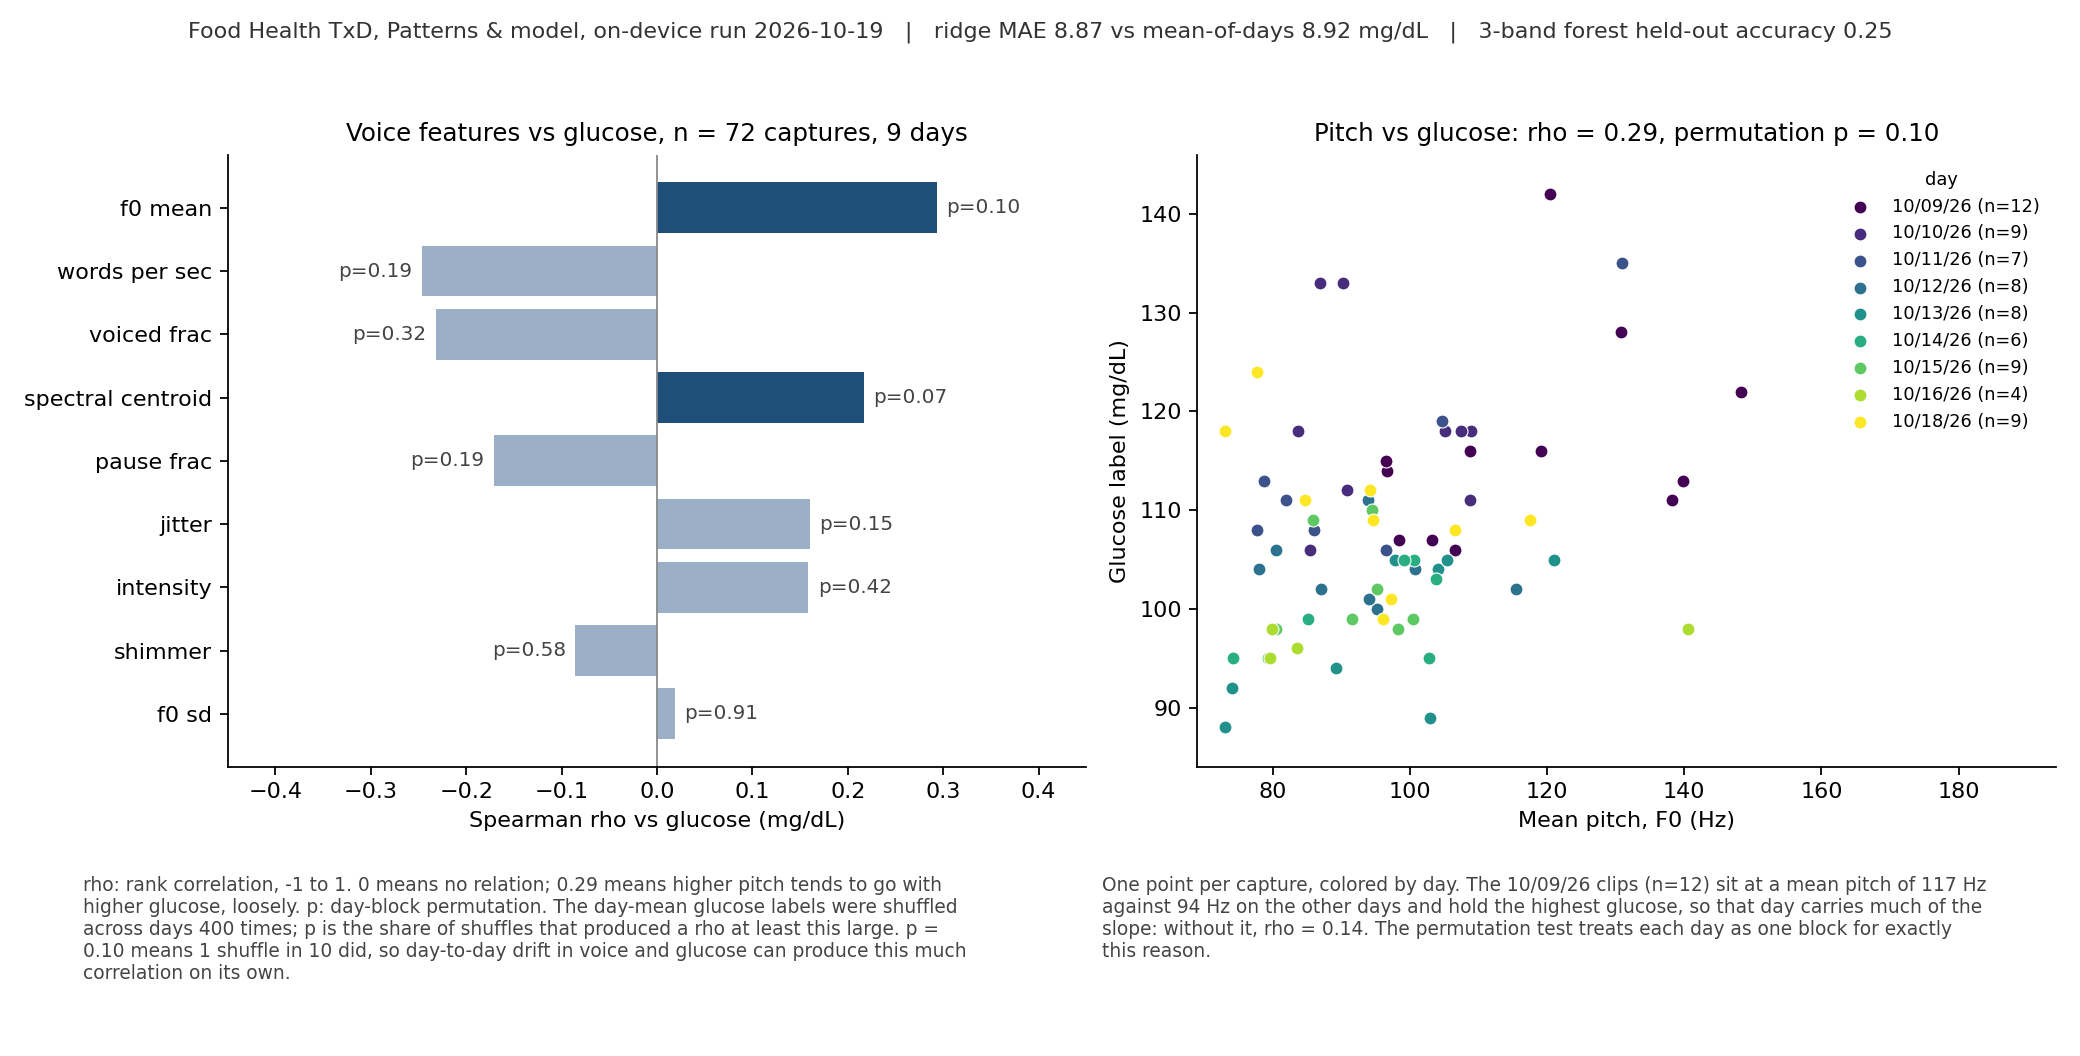
That last point is where my own data sits today. The most recent run on my phone covers 72 voice captures over nine days, labeled between 88 and 142 mg/dL. Pitch had the largest correlation with glucose, a Spearman rho of 0.29, and nothing passed a permutation p of 0.05. Leave-one-day-out ridge predicted held-out days with a mean absolute error of 8.87 mg/dL against 8.92 for the training-days mean, and the three-band forest scored 0.25 on held-out days.
Two words on what those numbers mean, because the Patterns page shows them to every user. Rho is a rank correlation from -1 to 1: 0 means no relation, 1 means glucose rises every time the feature does. A rho of 0.29 says higher pitch tends to go with higher glucose, loosely, and the scatter below shows that loosely. The permutation p asks a harder question: could day-to-day drift alone produce a rho this large? The app shuffles the day-mean glucose labels across days 400 times and counts how often the shuffled data correlates at least as well. For pitch that happened 1 time in 10, so p is 0.10. The reason the test works in day blocks is visible in the figure. The clips from 10/09/26 sit at a mean pitch of 117 Hz against 92 to 96 Hz on every other day, and they also hold the highest glucose. Leave that one day out and rho drops to 0.14. Within single days the sign is not stable either, from 0.73 on 10/13 to -0.77 on 10/18. A second pass over the same clips on the Mac points at the likely culprit: the relationship appears in the iPhone recordings (0.38) and not in the Android ones (-0.10), which says microphone and processing, and the apparent slope of about 0.4 Hz per mg/dL is roughly 19 times what Kaufman’s 505-person study measured. An effect that much larger than a large study found is a warning sign. So the honest reading is a small positive tendency that cannot yet be separated from whatever else changed between days: hydration, time of day, a cold, which phone was held. The literature says the within-person effect is on the order of 2 Hz of pitch per 100 mg/dL against day-to-day pitch noise of 10 to 20 Hz, which is why the instrument needs many more labeled clips, spread across many more days and across the full glucose range, before it can see anything. That is what the app is collecting, one check-in at a time, and the number on the screen will change only when the data does.
What two weeks of my own data say so far
Voice and face are the newest capture, but the app has been pairing meal photos with the sensor for longer, so I ran all three channels through the same two-week window on the Mac. The food scans carried the clearest signal.
Meals. 125 scanned meals, with scans less than 20 minutes apart counted as one meal. 95 had sensor coverage from before eating to three hours after, and 47 had no other carb-containing food logged in the following two hours, so each rise in that set comes from one meal. The typical response was a median rise of 23 mg/dL, peaking about 65 minutes after eating. Carbs set a threshold:

Every meal under 30 g of carbohydrate kept my glucose rise under 30 mg/dL, while about 40% of larger meals went past it. A model using the scan’s nutrients plus starting glucose and time of day predicted the size of each rise 28% better than guessing my average rise, with predicted and actual rises correlating at 0.73; carbs alone gave 15% and 0.55. Each day was predicted using only the other days. The food that spiked me most was a snack: Trader Joe’s dark chocolate nut bars, about 45 g of carbs, produced my two largest rises (+82 and +41 mg/dL), more than meals with twice the carbs, and across the 7 meals that included them the average rise was 41 mg/dL, the highest of any food I eat often. This echoes the Weizmann Institute’s finding that responses to the same food differ markedly between people (Zeevi et al., Cell 2015). A food-by-food spike list is not yet possible: most foods appear in fewer than 10 clean meals. The app could flag a likely spiker once a food has been eaten about 5 to 10 times, and the next feature on the list is a post-scan line that reads “likely spike: +30 to 40 mg/dL, peak in about an hour”.
Cheek redness. The best lead in the face channel. Redness in my cheeks, measured from the daily selfie, rose with glucose at a correlation of 0.51 across 24 photos on 10 days, with a day-to-day uncertainty range of 0.18 to 0.75. It holds within a single day (0.45), so it is not good days against bad days, and it holds after removing photo brightness and time of day (0.49). It may be ordinary flushing after eating, since food raises both skin blood flow and glucose. Blanes-Vidal and colleagues (Journal of Diabetes Research, 2019) found that people with diabetes showed more pulse-to-pulse variation in facial redness measured from video, while average redness did not differ from controls. TxD measures average redness from a single photo, so that paper supports the idea without confirming this finding.
Voice pitch. A correlation of 0.26 across 71 recordings, with a plausible range that includes zero (-0.02 to 0.56), and the phone split described above. Kaufman’s group concluded that voice-based glucose models will need to be personalized to each person, which is the case for collecting more of my own recordings rather than fewer.
Every figure in this section comes from one person over about two weeks, in a narrow glucose range. They are leads to follow, and the point of the app is that the same analysis runs for each user on their own data.
Available on both platforms, today
TxD runs on iPhone (iOS 17.0 or later) and on Android, with a free trial and a subscription after that. The direct Dexcom read and the voice and face check-ins are live on both. If you have been quietly annoyed at your glucose chart for months without knowing why, the fix is a Settings toggle away.
We are also handing out free access codes, one per person, while they last. Pick iPhone or Android, enter your email, and the code comes to you. All we ask in return is that you showcase a few meals and help the Food Health community see what people are actually eating.
Get a free access code at foodhealthscan.com/free →
See Direct Dexcom Reading on Food Health TxD →
The take-home
Your sensor was never the slow part. The handoff between apps was, and two open-source communities had already solved it. Once readings arrive in minutes, a glucose label can be attached to something as ordinary as a voice note, and the dataset nobody has can start to exist on your own phone.
References
Food Health TxD, Direct Dexcom Reading: https://foodhealthscan.com/txd/#dexcom
Dexcom, “How do I share my G7 glucose data with the Apple Health app?”: https://www.dexcom.com/en-us/m/faqs/how-do-i-share-my-glucose-data-with-the-apple-health-app
Dexcom, Stelo, “How do I share my Stelo glucose data with health apps?”: https://www.stelo.com/en-us/faqs/using-stelo/how-do-i-share-my-glucose-data-with-health-apps
Dexcom, “Can I share my glucose data with Health Connect?”: https://www.dexcom.com/en-gb/faqs/how-do-i-share-my-glucose-data-s-health-app
xDrip4iOS (xdripswift), the engine behind the direct read on iPhone: https://github.com/JohanDegraeve/xdripswift
xDrip+, the Nightscout Foundation engine behind the direct read on Android: https://github.com/NightscoutFoundation/xDrip
Muskal, S. “Why I Started Talking to My Computer Instead of Typing at It.” October 10, 2026. Substack: https://www.drstevenmuskal.com/p/why-i-started-talking-to-my-computer
Muskal, S. “The Metabolic Crisis Is Not a News Story.” May 6, 2026. Medium: https://medium.com/@smuskal/the-metabolic-crisis-is-not-a-news-story-3ea7ffada493 · Substack: https://www.drstevenmuskal.com/p/the-metabolic-crisis-is-not-a-news
Kaufman JM, et al. Acoustic Analysis and Prediction of Type 2 Diabetes Mellitus Using Smartphone-Recorded Voice Segments. Mayo Clinic Proceedings: Digital Health, 2023. doi:10.1016/j.mcpdig.2023.08.005
Kaufman JM, Jeon J, Oreskovic J, Fossat Y. Linear effects of glucose levels on voice fundamental frequency in type 2 diabetes and individuals with normoglycemia. Scientific Reports 14, 2024. doi:10.1038/s41598-024-69620-z
Lehmann V, Hilpert M, Mostaani Z, et al. Listening to Hypoglycemia: Voice as a Biomarker for Detection of a Medical Emergency Using Machine Learning. Diabetes Care, 2026. doi:10.2337/dc25-1680
Hepkarsi S, Bildaci TB, Yavas Z. Vocal Shimmer: A Potential Clinical Biomarker for Gestational Diabetes. Journal of Voice, 2026. doi:10.1016/j.jvoice.2026.04.040
Hamdan AL, Abi Zeid Daou C, et al. Effect of Diabetes Mellitus Type 2 on Voice: A Systematic Review and Meta-Analysis. Folia Phoniatrica et Logopaedica, 2024. doi:10.1159/000534271
Elbéji A, et al. A voice-based algorithm can predict type 2 diabetes status in USA adults: Findings from the Colive Voice study. PLOS Digital Health, 2024. doi:10.1371/journal.pdig.0000679
Shukla S, Naliyatthaliyazchayil P, Gichoya JW, et al. Demographic Confounding in Voice-Based Parkinson Disease Screening: Methodological Analysis of the Bridge2AI Voice Dataset. Journal of Medical Internet Research, 2026. doi:10.2196/95609
Zeevi D, Korem T, Zmora N, et al. Personalized Nutrition by Prediction of Glycemic Responses. Cell, 2015. https://www.wisdom.weizmann.ac.il/~eran/zeevi_cell_2015.pdf
Blanes-Vidal V, et al. Invisible color variations of facial erythema: a novel early marker for diabetic complications? Journal of Diabetes Research, 2019. https://pmc.ncbi.nlm.nih.gov/articles/PMC6745171/
Guermazi B, et al. V2D: Detection of type 2 diabetes using only smartphone voice recordings via spectro-temporal transformer embeddings. IEEE Journal of Biomedical and Health Informatics, 2026. doi:10.1109/JBHI.2026.3730729
Steven Muskal, Ph.D. is the CEO of Eidogen-Sertanty, Inc. - a drug discovery informatics company. He has spent four decades working at the intersection of computational biology, AI, and drug discovery. He writes about AI, health, and the intersection of biology and technology at stevenmuskal.com